



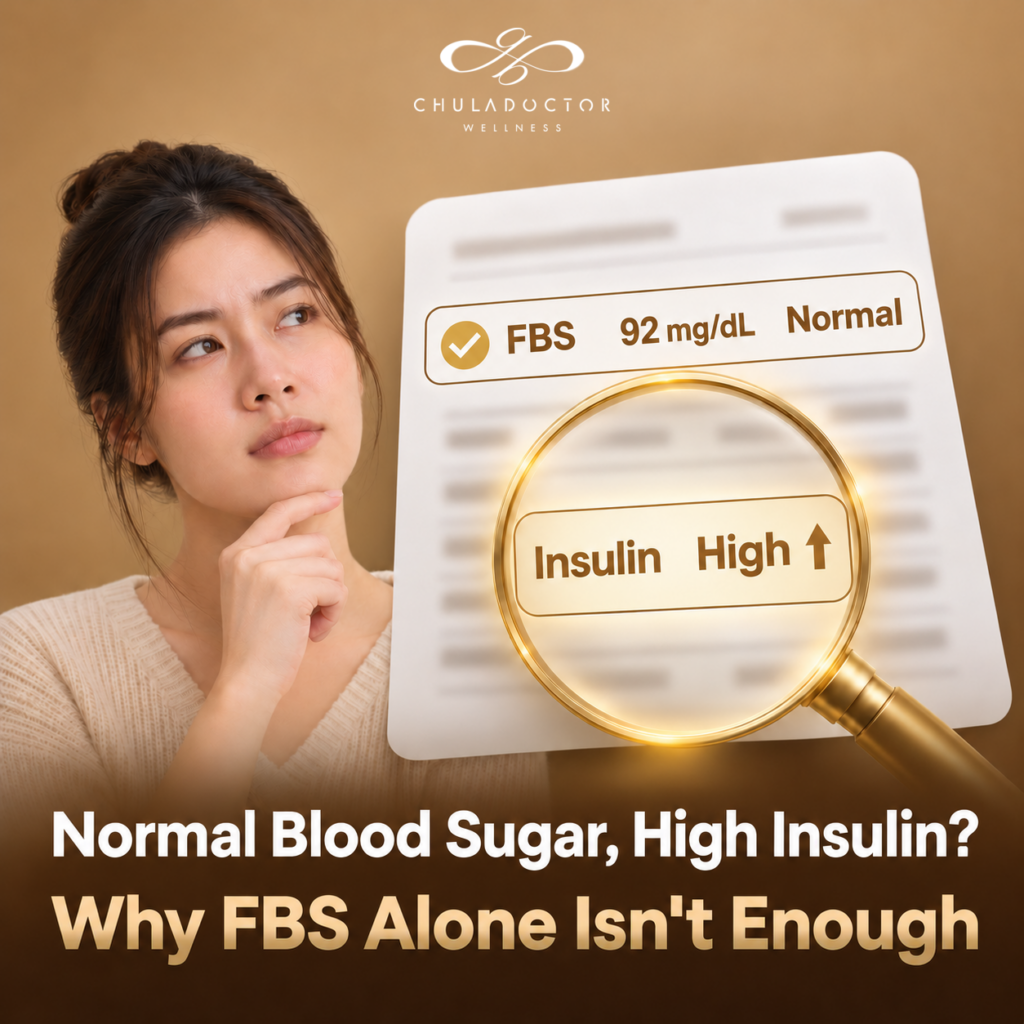
Many people open their annual health check report, see a fasting blood sugar (FBS) in the low 90s marked “normal,” and breathe a sigh of relief that diabetes is nowhere near. Yet day to day, they crash every afternoon after lunch, feel hungry soon after eating, watch their belly grow a little more each year, and find that no matter how hard they diet, the number on the scale barely moves. None of this seems to match a blood test that says everything is fine.
When the lab report says normal but the body is signaling the opposite, the real problem may not be blood sugar at all. It may be hiding in another hormone, the one working behind the scenes to keep blood sugar looking normal: insulin, which a standard FBS test does not measure at all.
So how can blood sugar be normal while insulin is high? This article takes a closer look at how insulin resistance develops while blood tests still look good, explains the blind spots of relying on FBS alone, and outlines which additional tests can give a clearer picture of your metabolic health.

What Does an FBS Test Measure, and What Does It Miss?
FBS (Fasting Blood Sugar), also called FPG (Fasting Plasma Glucose), measures the level of glucose in the blood after at least 8 hours without food or caloric drinks. It is a basic test included in almost every health check package because it is simple, inexpensive, and effective for diabetes screening. The American Diabetes Association (ADA) classifies the results as follows:
- Below 100 mg/dL: normal
- 100–125 mg/dL: impaired fasting glucose, also known as prediabetes
- 126 mg/dL or higher: meets the criteria for diabetes, if a repeat test gives the same result
These numbers clearly show where your blood sugar stands right now. What they cannot show is how much insulin your body needs to keep blood sugar at that level, and it is this second piece of information that more accurately reflects insulin resistance.
How Can Blood Sugar Be Normal While Insulin Is High?
Insulin is a hormone made by the pancreas. It moves sugar from the blood into muscle, liver, and fat cells, where it is used for energy or stored. When cells start responding less to insulin, sugar has a harder time getting in, so the pancreas compensates by releasing more insulin than before until blood sugar returns to the normal range.
This compensation can keep blood test results looking good for years, while insulin levels inside the body stay persistently high, a condition known medically as hyperinsulinemia. The problem generally progresses in stages, as follows:
1. The Compensation Stage (Compensatory Hyperinsulinemia)
In the early stage, cells begin to resist insulin, but the pancreas is still strong enough to keep up by producing more of it. FBS and average blood sugar (HbA1c) both remain normal even though insulin levels are higher than they should be. This is the stage when many people start noticing frequent hunger, belly fat, or sleepiness after meals without knowing the cause.
2. The Stage Where After-Meal Blood Sugar Starts to Swing
As insulin resistance increases, the body can still control blood sugar in the fasting state in the morning. But after a large, starchy meal, blood sugar spikes higher and comes down more slowly than normal. Problems at this stage are usually picked up by an oral glucose tolerance test (OGTT) rather than by FBS.
3. The Pancreatic Exhaustion Stage
After working overtime for a long period, the insulin-producing cells of the pancreas can no longer keep up with demand. FBS and HbA1c gradually rise into the prediabetes range and eventually progress to type 2 diabetes. By the time the FBS result on the report turns red, insulin resistance has already been underway for a long time.
This is consistent with research that measured both glucose and insulin during OGTTs in large numbers of people, which found that a considerable share of those with normal glucose results already had abnormal insulin response patterns. Studies that followed participants for decades have also found that high fasting insulin is a strong predictor of developing type 2 diabetes.

What Are the Blind Spots of Relying on FBS Alone?
The FBS test is not wrong, and it remains a necessary test. But if it is the only number used to assess metabolic health, several important pieces of information can be missed, as follows:
1. It Shows the Outcome, Not the Cause
FBS measures the end result: the blood sugar level the body has managed to maintain. It does not reveal how hard the pancreas is working. Two people can both have an FBS of 90, yet one may be using a normal amount of insulin while the other needs several times more insulin to reach the same number.
2. It Cannot See After-Meal Blood Sugar
A morning test after an overnight fast captures the moment when the body is under the least strain, while early abnormalities tend to appear after meals, which an FBS test cannot see at all.
3. The Number Stays in Range but Creeps Up Every Year
An FBS that moves from 82 to 88 to 96 over three years is labeled “normal” every time, yet this gradual upward trend says more than any single year’s number. Comparing results over time is just as important as looking at the latest one.
4. Results Fluctuate With How You Prepare
Lack of sleep, high stress, illness, or fasting for too long can all change an FBS reading. A result from a single test may therefore not reflect the body’s true condition.
Signs That You Should Test Beyond FBS
Even if your blood sugar is normal, you should consult a doctor about a further assessment for insulin resistance if you have any of the following factors or symptoms:
- Waist size above the recommended limit: 90 cm or more for men, or 80 cm or more for women (cutoffs for Asian populations), even if overall body weight is not high
- Sleepiness or fatigue after meals: especially after meals high in starch or sugar
- Getting hungry quickly and craving sweets: feeling hungry again soon after a full meal
- Thick, darkened skin in body folds or on the back of the neck: or skin tags on the neck, a skin sign of high insulin
- High triglycerides or low HDL: even when LDL is not high
- Related conditions: such as fatty liver disease, high blood pressure, polycystic ovary syndrome (PCOS), or a history of gestational diabetes
- A parent or sibling with type 2 diabetes

Which Additional Tests Can Reveal Insulin Resistance?
There is currently no single test in routine clinical practice that fully diagnoses insulin resistance on its own. Doctors therefore usually look at several values together to see blood sugar, insulin levels, and the effects on blood fats, as follows:
1. Fasting Insulin
This measures the level of insulin in the blood, taken together with FBS in the morning. If blood sugar is normal but insulin is high, it means the body is having to release more insulin than usual to keep blood sugar under control. Reference ranges for insulin vary by assay and laboratory, so results should be interpreted with a doctor.
2. HOMA-IR
HOMA-IR (Homeostatic Model Assessment of Insulin Resistance) is calculated from fasting glucose and fasting insulin using the formula FBS (mg/dL) × fasting insulin (µIU/mL) ÷ 405. The higher the value, the greater the degree of insulin resistance. Cutoffs differ by population and study: a study in Thai working-age adults used a cutoff of around 1.6, while many other studies use 2.0 or higher. Doctors therefore usually interpret it alongside each person’s other health information.
3. Average Blood Sugar (HbA1c)
HbA1c reflects average blood sugar over roughly the previous 2–3 months, which helps reduce the problem of fluctuations from a single test. A value of 5.7–6.4% falls in the prediabetes range. However, HbA1c still measures sugar rather than insulin, so like FBS, it tends to rise later than insulin resistance itself.
4. Oral Glucose Tolerance Test (OGTT)
The person being tested drinks 75 grams of glucose, and blood is drawn at set times. A 2-hour glucose value of 140–199 mg/dL indicates impaired glucose tolerance. In some cases, the doctor may also order insulin measurements to see how much insulin the body has to release after the sugar load.
5. Triglyceride-to-HDL Ratio (TG/HDL Ratio)
Insulin resistance causes the liver to produce more triglycerides and lowers HDL. This ratio can be calculated from the lipid panel many people already have, making it a useful supporting marker, especially when considered together with waist size and other values.
Summary Table: Comparing Tests Used to Assess Insulin Resistance
| Test | What It Measures | Strengths | Limitations |
|---|---|---|---|
| FBS | Fasting blood sugar | Simple; good for diabetes screening | Often becomes abnormal late; does not show insulin |
| Fasting Insulin | Fasting insulin level | Shows the strain on the pancreas from an early stage | Reference ranges vary by laboratory |
| HOMA-IR | Calculated from glucose and insulin | Quantifies insulin resistance as a number | Cutoffs still vary by population |
| HbA1c | Average blood sugar over 2–3 months | Not affected by single-test fluctuations | Still a sugar measure; rises late, like FBS |
| OGTT | Glucose (and insulin) after a glucose drink | Reveals after-meal abnormalities | Time-consuming; requires several blood draws |
| TG/HDL | Ratio of blood fats | Calculated from an existing lipid panel | An indirect marker |

What Do You Gain From Detecting Insulin Resistance Early?
The key benefit of detecting it while blood sugar is still normal is that insulin resistance at this stage has a good chance of being reversed, because the pancreas is still working well. Making lifestyle changes early can relieve the strain on the pancreas in time, before the damage becomes entrenched and turns into a chronic disease. The main approaches doctors usually recommend are as follows:
- Cut back on refined starches and sugary drinks: choose high-fiber carbohydrates and include protein and vegetables at every meal
- Build muscle mass: resistance exercise helps muscles take up and use more glucose
- Move after meals: a light 10–15 minute walk after eating helps reduce after-meal blood sugar spikes
- Get enough sleep and manage stress: sleep deprivation and persistently high cortisol accelerate insulin resistance
- Follow up with regular tests: retest as scheduled by your doctor to see whether insulin and HOMA-IR are responding to lifestyle changes
For some people with multiple risk factors, or whose results do not improve with lifestyle changes, a doctor may also consider medication. Results vary from person to person, and treatment should always be supervised by a doctor.
Conclusion
Insulin resistance does not begin on the day your FBS result turns red. It begins years earlier, while the pancreas is quietly working overtime to keep blood sugar looking normal. An FBS test alone sees only the outcome, while the root cause stays hidden in an insulin level no one has measured.
If you experience sleepiness after meals, belly fat, or frequent hunger, or have risk factors such as a family history of diabetes, testing fasting insulin, HOMA-IR, and HbA1c alongside FBS can give a more complete picture of your metabolic health. At Chula Doctor Wellness, our team of doctors is ready to assess insulin resistance holistically, interpret your test results in the context of your overall health, and create a sustainable plan for your metabolic health before it is too late. Individual results vary; please consult a doctor for advice suited to you.